Polymarket PnL: Why Every Tool Shows a Different Number, and How to Calculate It
Why Polymarket PnL differs across tools, how 6-decimal average-price truncation causes drift, and how to calculate exact FIFO PnL in Python.
Look up one Polymarket wallet in three tools and you can get three different PnL numbers.
Sometimes the gap is a few cents. Sometimes it is thousands of dollars. For a dashboard that is annoying. For a leaderboard, a copy-trading screen, a fund report or a tax file, it is a real problem.
Most of these gaps are not bugs. They come from a few decisions every PnL calculation has to make. Which positions do you count? Are fees inside the number? Are rebates part of PnL? How do you track cost basis?
One gap does come from arithmetic, and it is easy to miss. Polymarket's position PnL drifts upward as a position gets more fills, because the running average entry price is cut to 6 decimals after every buy. An exact FIFO ledger built from on-chain settlement does not drift.
This guide explains where the differences come from and what we found when we checked real wallets against the chain. It ends with Python code you can use to calculate PnL yourself.
Why do Polymarket PnL numbers differ between tools?
A PnL number is the result of a method. Two tools can read the same trades and still report different totals.
There are five common sources of difference.
1. Which positions are included
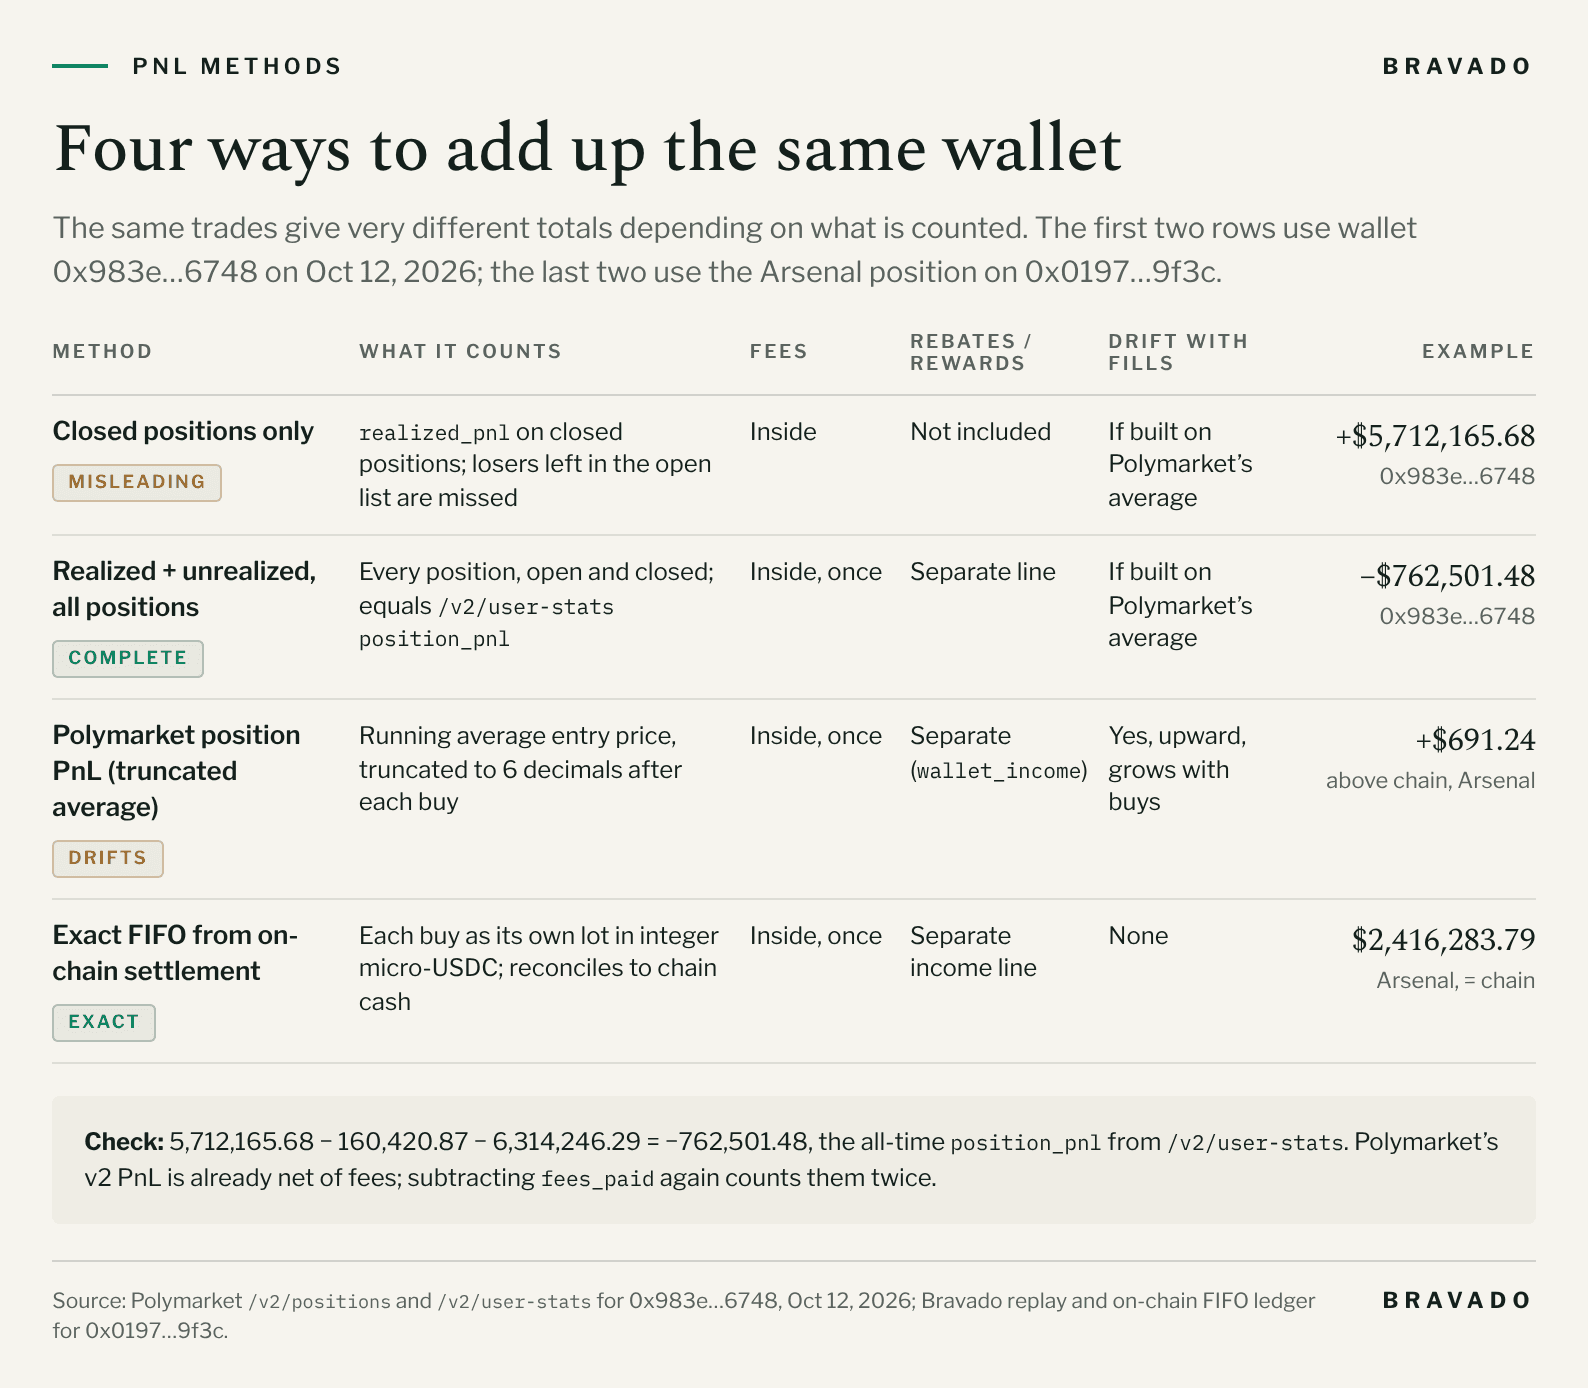
Some tools add up closed positions only. Others add realized and unrealized PnL across every position. These can be very different numbers. We show a real example below.
2. Whether fees are inside the number
Polymarket's v2 PnL is net of fees. If a tool subtracts fees again, the wallet looks worse than it is. If a tool reports gross trade PnL, the wallet looks better.
3. Whether rebates and rewards are included
Maker rebates, taker rebates and liquidity rewards are cash the wallet received. They are not trading PnL. Some tools add them in. Others leave them out.
4. When the number was computed
Each source reads the chain up to some block. A wallet that traded in the last hour can show different numbers in two tools simply because one is behind.
5. How cost basis is tracked
Polymarket uses a running average entry price. Other tools use FIFO lots. Both are valid methods. But the way the average is stored matters, and that is where drift comes from.
What is the "right" PnL for a Polymarket wallet?
There is one number every method should agree on: total PnL.
Total PnL is all the cash that went out of and came back into the wallet through trades, splits, merges and redemptions, plus the current value of whatever the wallet still holds.
Realized and unrealized PnL are two ways of splitting that total. The split depends on the cost-basis method (FIFO or average cost). The total does not.
That gives you a simple test for any PnL tool. Add its realized and unrealized PnL. Compare the result to the cash ledger from the chain. If they differ, the tool is missing something or adding something.
Why does Polymarket's position PnL drift with trade count?
Polymarket tracks each position with a running average entry price, avg_price.
Every time you buy, the new average is:
Polymarket does not document how it rounds this average. But we reproduced Polymarket's per-position figures to the cent with one rule: truncate the new average to 6 decimals after every buy. Truncation always rounds down. Under that rule, the stored average entry price ends up slightly lower than the true one.
A lower entry price means a higher realized PnL when the position is sold or resolves.
One buy loses at most $0.000001 per share. That sounds like nothing. But it repeats on every buy, and each truncated average feeds the next one. A position with hundreds of fills and millions of shares builds up a visible gap.
1. A worked example: one position, 658 buys
Wallet 0x0197…9f3c bought "Arsenal win" (March 1, 2026) in 658 separate buys.
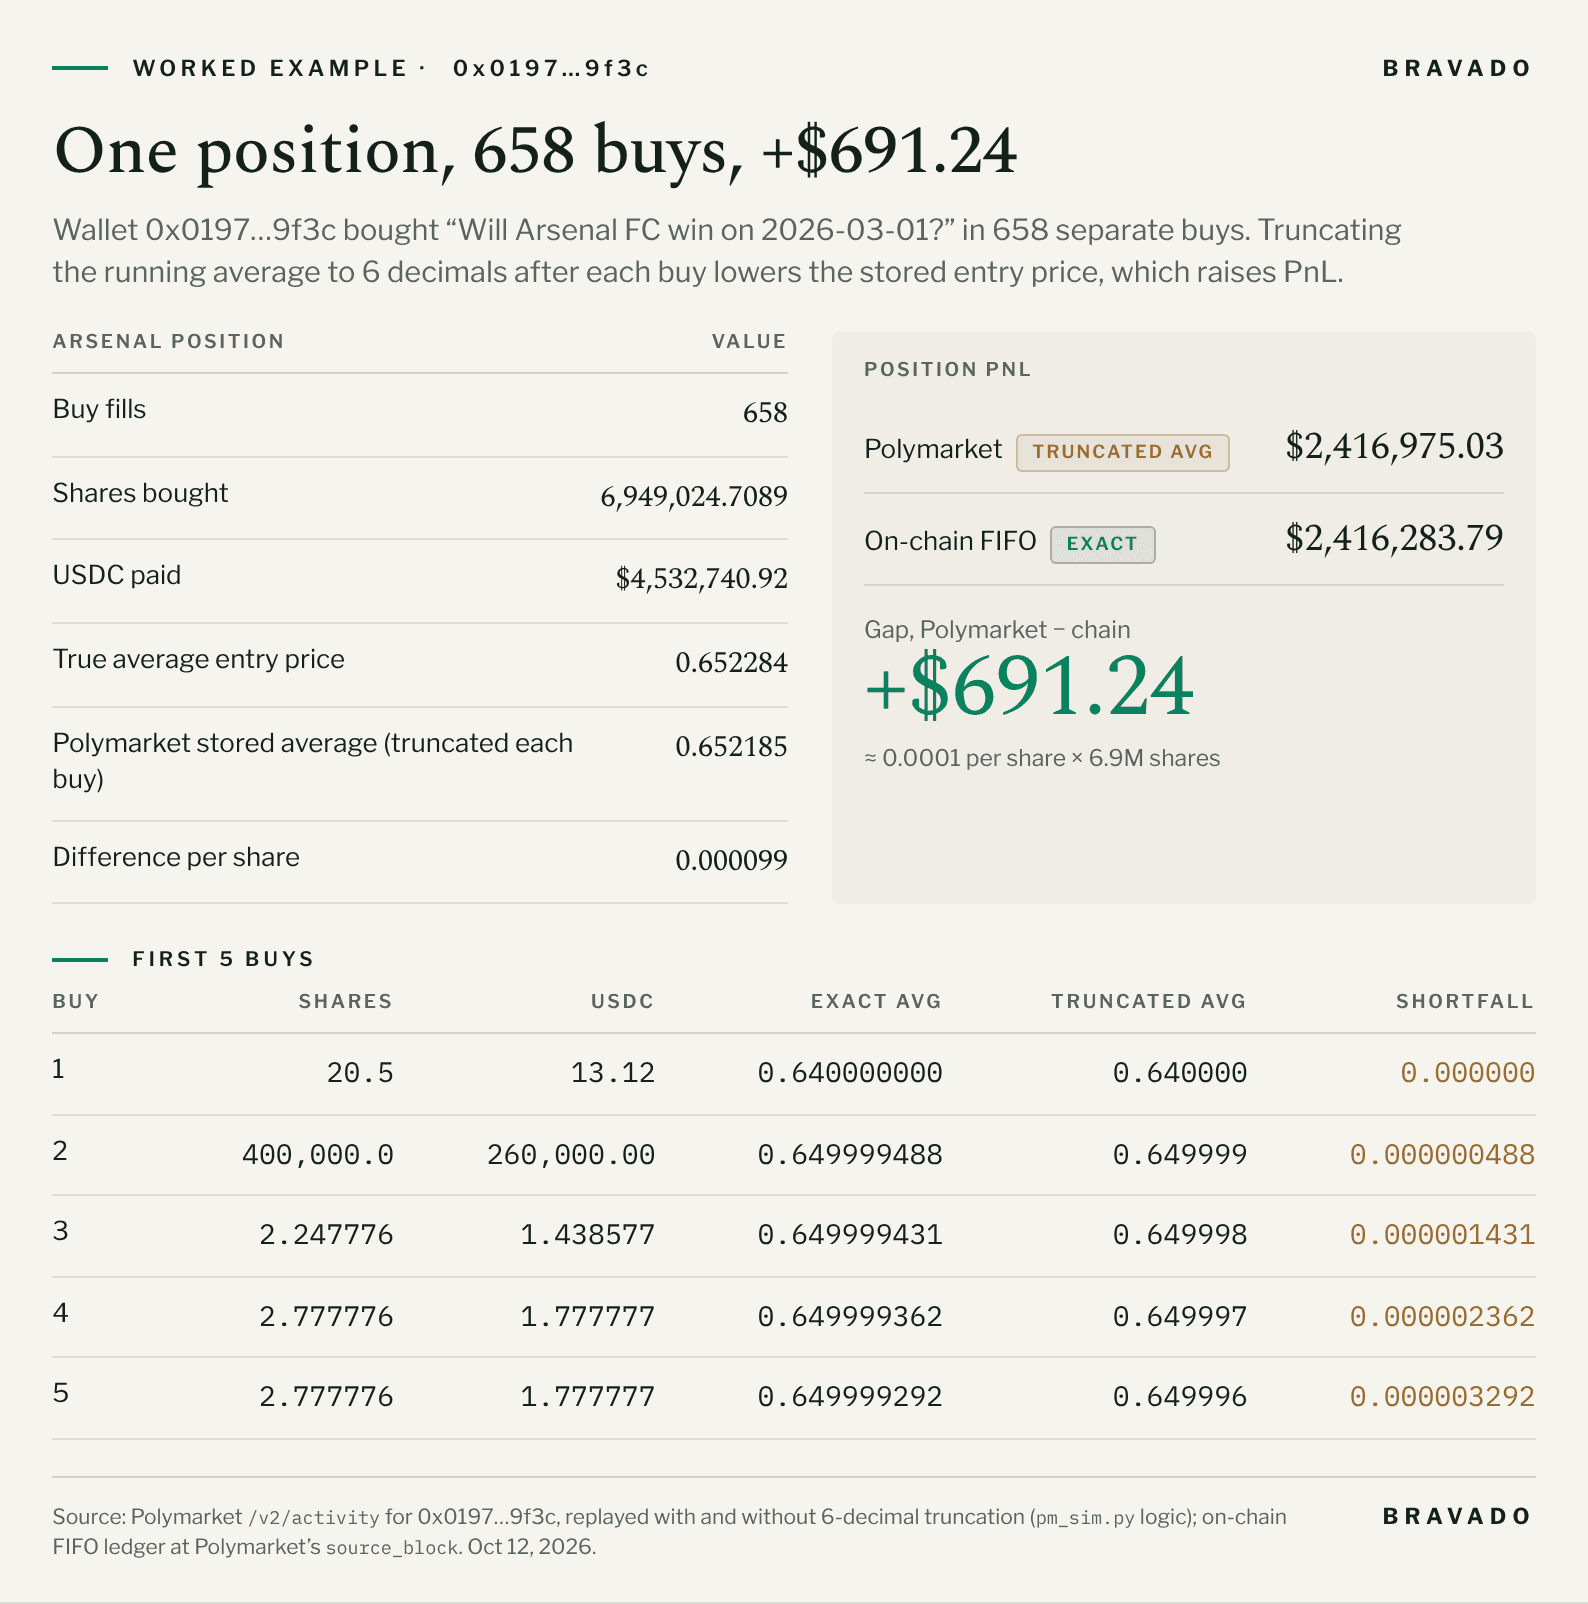
Value | |
|---|---|
Buy fills | 658 |
Shares bought | 6,949,024.7089 |
USDC paid | $4,532,740.92 |
True average entry price | 0.652284 |
Polymarket's stored average (truncated each buy) | 0.652185 |
Polymarket position PnL | $2,416,975.03 |
On-chain FIFO PnL | $2,416,283.79 |
Difference | +$691.24 |
The gap is about 0.0001 per share. Multiplied by about 6.9 million shares, that is roughly $690.
When we replayed Polymarket's own activity feed with the 6-decimal truncation rule, we reproduced Polymarket's number to the cent. With exact arithmetic, we got the on-chain number.
The trade data itself was not the problem. We compared Polymarket's activity cash against the chain for every one of this wallet's 658 transactions and found zero mismatches. The difference appears only in the position math.
2. A bigger example: one 2024 election wallet
The wallet known as Theo4 (0x5668…5839) traded the 2024 US election in more than 16,000 trades.
Market | Buy fills | Polymarket | On-chain | Difference |
|---|---|---|---|---|
Kamala Harris wins the popular vote? (No) | 1,439 | $6,061,140.18 | $6,058,950.99 | +$2,189.19 |
All 14 markets the wallet traded | – | $22,053,933.75 | $22,029,972.64 | +$23,961.12 |
On the Kamala market, the truncated replay matches Polymarket exactly.
Across all 14 markets, Polymarket is higher than the chain on every single one. The largest gaps are on the markets with the most fills. (Some of this wallet's markets include merges. Our replay does not model merges, so for those markets we can show the direction of the gap but not reproduce it to the cent.)
3. The pattern across 1,449 positions
We replayed 1,449 positions from 11 wallets where the replay reproduced Polymarket's number within one cent. Then we compared that number with exact arithmetic.
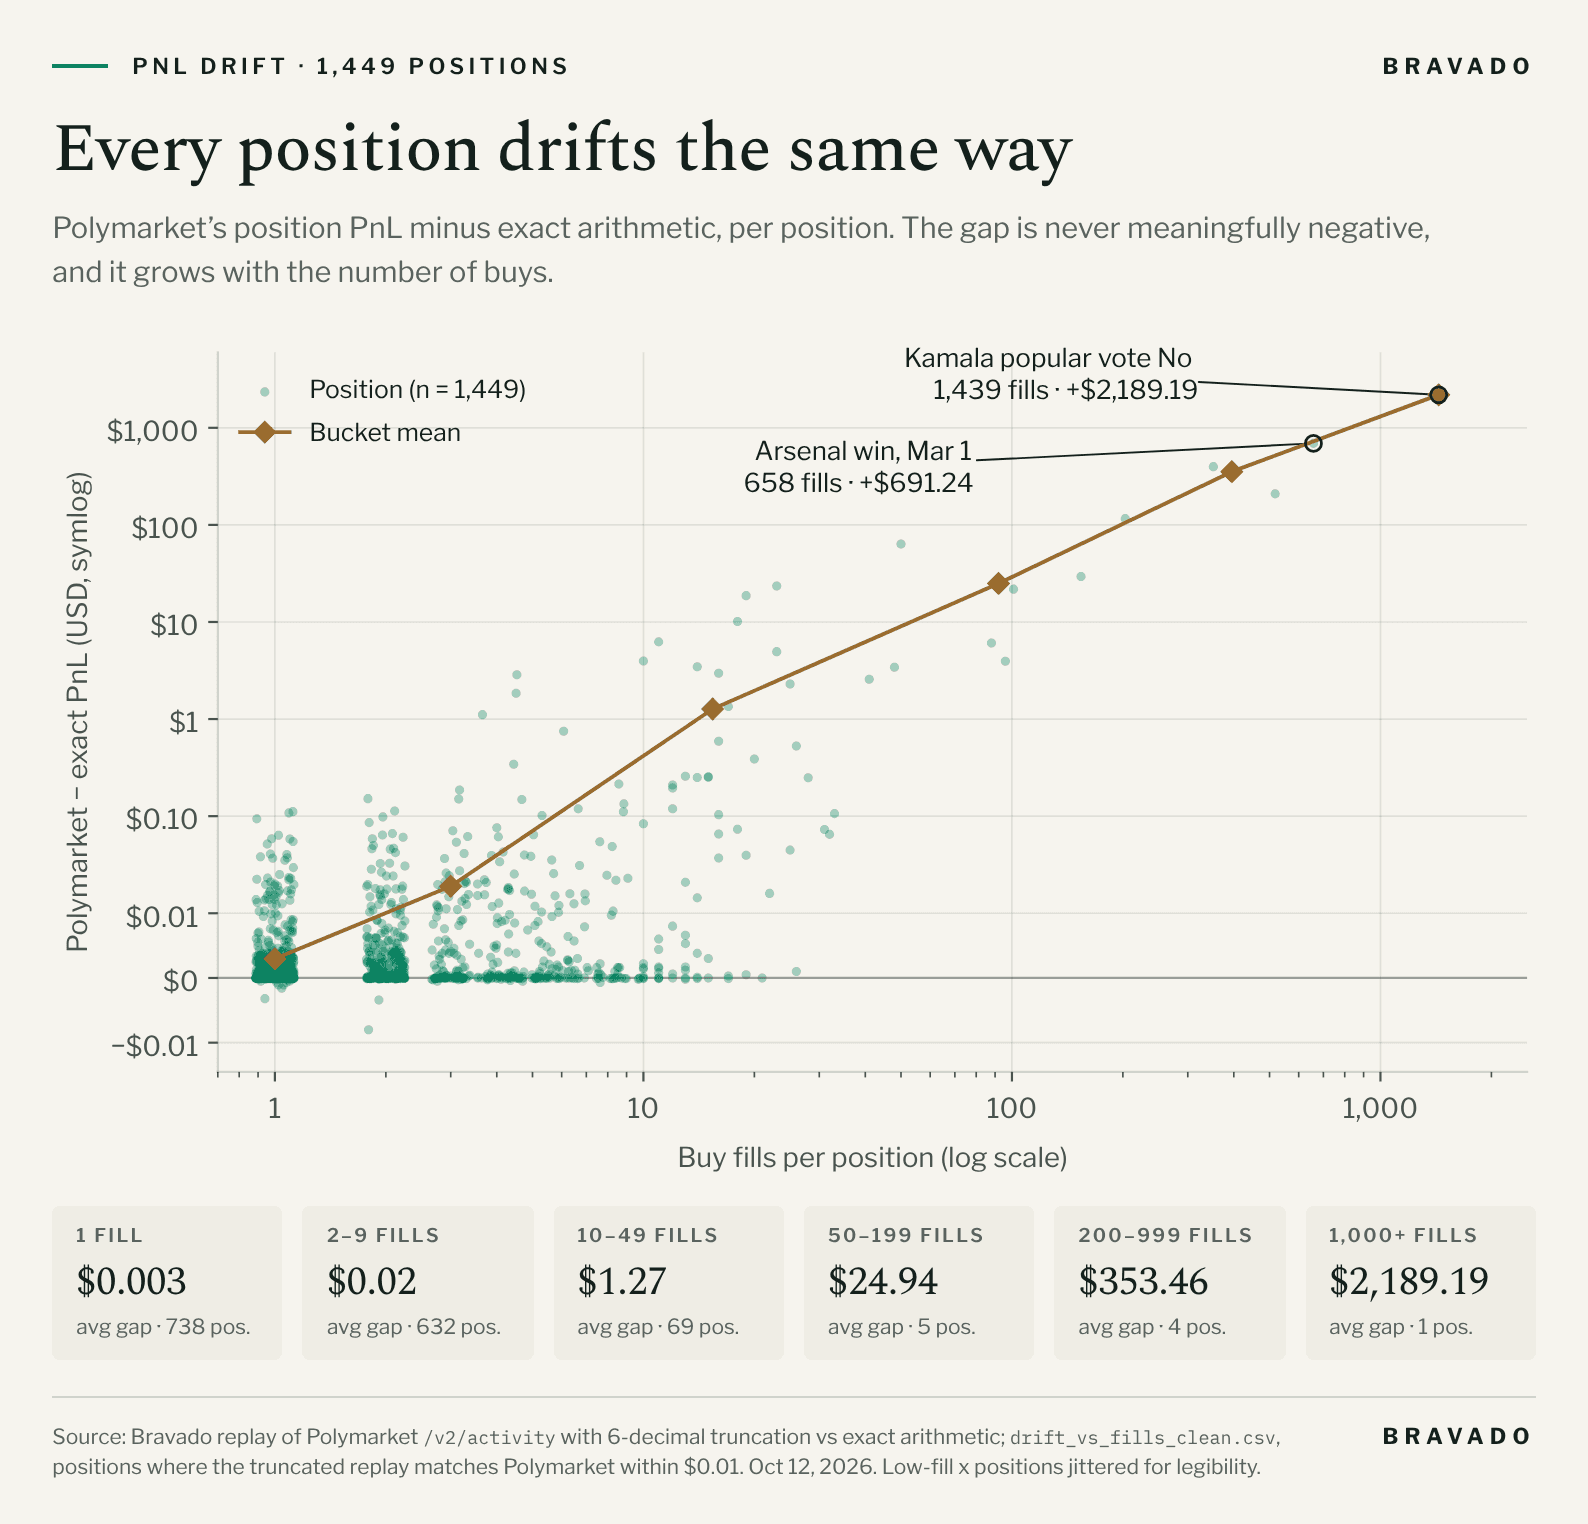
Buy fills per position | Positions | Average gap (Polymarket − exact) | Largest gap |
|---|---|---|---|
1 | 738 | $0.003 | $0.11 |
2–9 | 632 | $0.02 | $2.86 |
10–49 | 69 | $1.27 | $23.48 |
50–199 | 5 | $24.94 | $63.44 |
200–999 | 4 | $353.46 | $691.24 |
1,000+ | 1 | $2,189.19 | $2,189.19 |
No position in this set was more than one cent below the exact number. The gap only goes one way, and it grows with the number of fills.
For a casual trader with a few buys per market, this does not matter. For market makers, bots and whales who build positions in hundreds of small fills, it adds up to hundreds or thousands of dollars per position.
4. Why an exact FIFO ledger does not drift
A FIFO ledger keeps each buy as its own lot: shares and the exact cost paid, in integer micro-USDC. When shares are sold or resolve, it uses up the oldest lots first and subtracts their exact cost.
There is no running average to round. The ledger can be checked against the chain's cash flows to the micro-dollar, and it stays exact no matter how many fills there are.
What are the most common PnL mistakes?
The rounding drift is small next to the mistakes people make when they build PnL themselves. Here are the four we see most, with real numbers.
1. Summing only closed positions
It is tempting to call /v2/positions?status=CLOSED, add up realized_pnl and call that the wallet's PnL.
For wallet 0x983e…6748, on October 12, 2026:
Polymarket figure | Value |
|---|---|
Sum of | +$5,712,165.68 |
Sum of | −$160,420.87 |
Sum of | −$6,314,246.29 |
All-time position PnL ( | −$762,501.48 |
The closed-only sum says the wallet is up $5.7 million. It is actually down about $760,000.
The reason is that losing positions often stay in the "open" list. Nobody redeems a share worth $0, so the position never moves to the closed list, and its loss never shows up in the closed-only sum.
2. Not adding realized and unrealized over all positions
The fix is to add both fields across every position, open and closed. For 0x983e…6748:
That matches the all-time position_pnl from /v2/user-stats exactly. If you only need a wallet total, read /v2/user-stats directly.
3. Subtracting fees twice
Polymarket's v2 PnL fields are already net of fees. For wallet 0xff99…1b6d:
Field | Value |
|---|---|
| $360.37 |
| −$51.06 |
| $309.31 |
If you subtract fees_paid from position_pnl, you count the fees twice. On an active wallet this is a big error. Wallet 0x983e…6748 paid $300,555.15 in fees, and all of it is already inside its PnL.
4. Mixing rebates and rewards into trading PnL
Rebates and rewards are income, not trading PnL. Polymarket reports them separately as wallet_income, and adds them in economic_pnl.
For 0x983e…6748: position PnL −$762,501.48, plus wallet income $91,345.34, gives economic PnL −$671,156.13.
Be careful with the income figure too. When we summed the rebate and reward transfers this wallet received on-chain, we got $99,869.06, not $91,345.34. For wallet 0x0259…769e the gap was larger: $19,041.42 on-chain against $161.01 reported. If income matters for your use case, check it against the chain.
5. Reading v1 field names after October 24
Polymarket retires Data API v1 on October 24, 2026. Some PnL fields were renamed in v2, not just re-cased. For example, cashPnl is now unrealized_pnl and initialValue is now entry_cost_usdc, and /closed-positions is now /v2/positions?status=CLOSED.
If your PnL code still reads v1 fields, it will stop working. Our Polymarket Data API v2 migration guide covers the full list.
Why do Polymarket's own numbers miss some positions?
Rounding is not the only reason Polymarket's figures differ from the chain. We found two more, and both are easy to check yourself.
1. Some positions never appear in /v2/positions
For every wallet, we listed each market that shows up in Polymarket's own /v2/activity feed. Then we checked that the market also appears in /v2/positions, open or closed.
On two of our 14 wallets, it does not. Seven positions are missing. They are every position in our sample whose first trade happened between about 21:45 UTC on August 24 and 02:16 UTC on August 25, 2026.
Wallet | Market | First trade (UTC) | On-chain PnL | In |
|---|---|---|---|---|
0x8400…274c | Texas Rangers vs. Chicago White Sox: O/U 9.5 | Aug 25, 00:31 | +$739.09 | No |
0x8400…274c | Texas Rangers vs. Chicago White Sox: O/U 10.5 | Aug 25, 00:32 | +$60.76 | No |
0x8400…274c | Philadelphia Phillies vs. Seattle Mariners: O/U 10.5 | Aug 25, 02:16 | +$498.15 | No |
0x4c57…a7de | 4 tennis and soccer markets | Aug 24, 21:45–22:25 | −$212.85 | No |
The trades themselves are in the activity feed. For example, the Rangers O/U 9.5 buy is transaction 0x3153…efbce, and its redemption is 0xad7e…a7ab.
Asking /v2/positions for these markets by condition returns an empty list, both open and closed. The v1 /closed-positions endpoint also returned nothing for the one we tried.
On 0x8400…274c, the three missing positions are also left out of the wallet's realized PnL. Together they are three MLB winners worth $1,298.00. Because they are missing, Polymarket understates this wallet's PnL by that amount.
Polymarket has not said why these positions are missing. They are only the ones whose first trade falls in that window: positions opened a few hours earlier or later on the same wallets are listed normally. That pattern points to a gap in how the positions were indexed, not to a problem with the trades.
2. Converted neg-risk positions can lose their cost
Multi-outcome markets on Polymarket, such as "World Cup Winner", use the NegRiskAdapter. One of its features is a conversion. You give up NO shares in one outcome and receive YES shares in every other outcome.
A conversion is not a trade. No profit or loss should come from it. The cost of the NO shares should move to the new YES shares.
We found three wallets that converted World Cup and Super Bowl positions, and we rebuilt their histories from the chain.
Wallet | Conversions | YES legs created | Legs missing from |
|
|
|---|---|---|---|---|---|
0xf344…9a04 | 2 | 61 | 10 | +$19,363.86 | +$2.58 |
0x87c6…89b7 | 2 | 59 | 10 | +$26.63 | +$3.04 |
0xd8a2…0d63 | 48 | 82 | 16 | +$74.24 | +$54.20 |
Take 0xf344…9a04. In transaction 0xdeb6…9f03, it converted 122,796.36 "Portugal wins the World Cup: No" shares into YES shares of the other teams.
The positions endpoint shows the Portugal NO position as closed, with $0 realized PnL. Most of the new YES positions lost, but they also show $0 PnL. So the cost of the converted shares does not show up anywhere in the position list. Adding up the positions gives a total that is $19,363.86 higher than the chain. Of that, $19,361.38 is converted cost on the markets the conversions touched.
The wallet-level number from /v2/user-stats is different. It is within $3 of the chain, and the rounding drift explains that gap. So if you need a wallet total, use /v2/user-stats. Do not add up positions for a wallet that has converted.
On 0x87c6…89b7, we can split the $26.63 gap: $9.29 is rounding drift and $17.34 is converted cost that is missing from the positions. On 0xd8a2…0d63, which converted 48 times, even /v2/user-stats is $54.20 above the chain.
Neg-risk markets are fine when you only buy and sell. Our replay reproduced Polymarket's figures on ordinary neg-risk positions with the same 6-decimal rule, and they show no extra error. The problem only appears once a conversion happens.

3. What this means for your own code
Check that every market in a wallet's activity has a row in
/v2/positions. If one is missing, rebuild that market from the activity feed.Do not add up
/v2/positionsfor a wallet that has converted. Look fortype=CONVERSIONin/v2/activity.Expect resolved losing positions to stay in the open list with their loss shown as
unrealized_pnl. Across our wallets, 187 such positions held −$9.96 million labelled "unrealized" that/v2/user-statscounts as realized. The total is right; the label is not.Reconcile against on-chain cash when the number matters.
How do you calculate Polymarket PnL yourself?
Here is a minimal exact FIFO ledger in Python. It reads Polymarket's v2 activity feed, keeps every buy as a lot in integer micro-units, and never rounds.
1. Fetch a wallet's activity
2. Convert to integer micro-units
Never use floats for money. Convert each amount to an integer number of millionths.
3. Build the FIFO ledger
This sketch handles trades only. A full ledger also books redemptions (shares go out, $1 or $0 per share comes in), splits, merges and conversions, and values open lots at the current price. Fees on v2 trades are already reflected in the cash amounts.
4. See the drift for yourself
Add a running average with 6-decimal truncation next to the FIFO ledger, and compare the two on any position with many buys.
On the Arsenal position above, this returns 0.652185. The exact average is 0.652284.
We tested it ourselves
We did not want to rely on theory, so we checked 14 real wallets.
The wallets ranged from small accounts with 20 trades to the Theo4 election wallet with more than 16,000. They included V1-era wallets, recent V2 wallets with fees, active market makers and wallets that traded Combos.
For each wallet we:
Pulled every transaction from Polygon and decoded the settlement events.
Built an exact FIFO ledger in integer micro-USDC, with balances checked against the chain at a pinned block.
Pulled Polymarket's
/v2/user-stats,/v2/positionsand/v2/activityfor the same wallet, and pinned our ledger to the block Polymarket reported (source_block).Replayed Polymarket's activity feed with and without 6-decimal truncation.
What we found:
Polymarket's activity feed matched on-chain cash to the micro-dollar on every transaction we checked (for example, 91 of 91 transactions on 0x7d2b…8e80 and 658 of 658 on 0x0197…9f3c).
Polymarket's per-position PnL was reproduced within one cent by the truncated replay on 1,449 positions. Exact arithmetic reproduced the chain.
On the wallets with many fills per position, Polymarket's total was above the chain: +$807.25 on 0x0197…9f3c, +$509.93 on 0x5e4c…dba2 and +$23,961.12 on Theo4.
On wallets with few fills per position, the gap was a few dollars or zero.
We also found differences that have nothing to do with rounding. Some positions are missing from Polymarket's position list entirely, and converted neg-risk positions lose part of their cost. We cover those next. We kept them out of the drift numbers above.
When the official API is not enough
Polymarket's Data API is a good place to start. For most wallets, its PnL is correct to within a few dollars, and /v2/user-stats gives you a single all-time number with fees and income already separated.
It is not enough when:
You need numbers that reconcile exactly to the chain, for accounting, tax or fund reporting.
You rank or compare wallets that trade in many small fills, where drift can reach thousands of dollars.
You need cost basis per lot rather than a single average price.
You need rebates and rewards that match what the wallet actually received.
In those cases you either build and maintain your own on-chain ledger, as in the code above, or use a data source that already does.
Why use Bravado's Data API
Bravado's Trader Data API computes wallet PnL from on-chain Polygon settlement, using a share-level FIFO cost-basis engine. It works on any public Polymarket address.
FIFO lots, no running average. Cost basis is tracked per share with FIFO, from on-chain settlement records. (Data API on Polymarket)
Conversions carry their cost. Bravado's ledger records neg-risk conversions and moves the cost of the converted shares to the new ones. On the two converting wallets above whose positions are all closed and fully accounted for (0xf344…9a04 and 0x87c6…89b7), its realized PnL matched the chain to the cent. On the wallet with 48 conversions (0xd8a2…0d63) it did not: it was $45.56 above the chain, and it flags 190 of those conversion rows as having unknown proceeds.
Fees counted once. Realized PnL already includes fees in proceeds and cost basis. It is never reduced by fees a second time. You can ask for
basis=netorbasis=grosson the trader summary. (Trader Data API, GET /traders/{address})Income kept separate.
income=detailsplits income into maker rebates, reward income and liquidity rewards, outside trading PnL. (GET /traders/{address})No float rounding. All numeric fields are JSON strings, so you can parse them with an arbitrary-precision type. (Data API on Polymarket)
Realized and unrealized together.
GET /traders/{address}/pnlreturns a cumulative PnL series with the realized and unrealized split, for equity curves. (Portfolio dashboards)Live fills with wallets. The Live Trades WebSocket streams every Polymarket fill with the trader's wallet address, and sends the last 200 trades on connect.
The main entry points:
Requests are signed with an API key from the Bravado Console. The free tier includes 5,000 API credits per month, and each Data API request costs 1 credit. The WebSocket needs an eligible paid plan.
To get an API key and see what is covered, visit Bravado's Data API and WebSockets.
Conclusion
Different Polymarket PnL numbers usually come from different methods, not wrong data.
Before you trust or compare a PnL figure, check four things:
Does it cover all positions, open and closed, realized and unrealized?
Are fees inside the number once, not zero times or twice?
Are rebates and rewards kept separate?
What block was it computed at?
After that, the remaining gap is arithmetic. Polymarket's running average, truncated to 6 decimals on each buy, pushes position PnL up a little on every fill. For most wallets it is cents. For high-frequency wallets it is hundreds or thousands of dollars per position, always in the same direction.
If you need numbers that match the chain, use exact FIFO lots in integer units, and test your results against on-chain cash. And if your code still uses Data API v1, migrate before October 24.
Read more blogs
Trading insights, market analysis, and strategies for Polymarket prediction markets.


